
Categories
D.C. Metro Real Estate, Housing Market UpdatesPublished October 6, 2026
Washington-area home contracts fall nearly 20% as buyers gain more choices

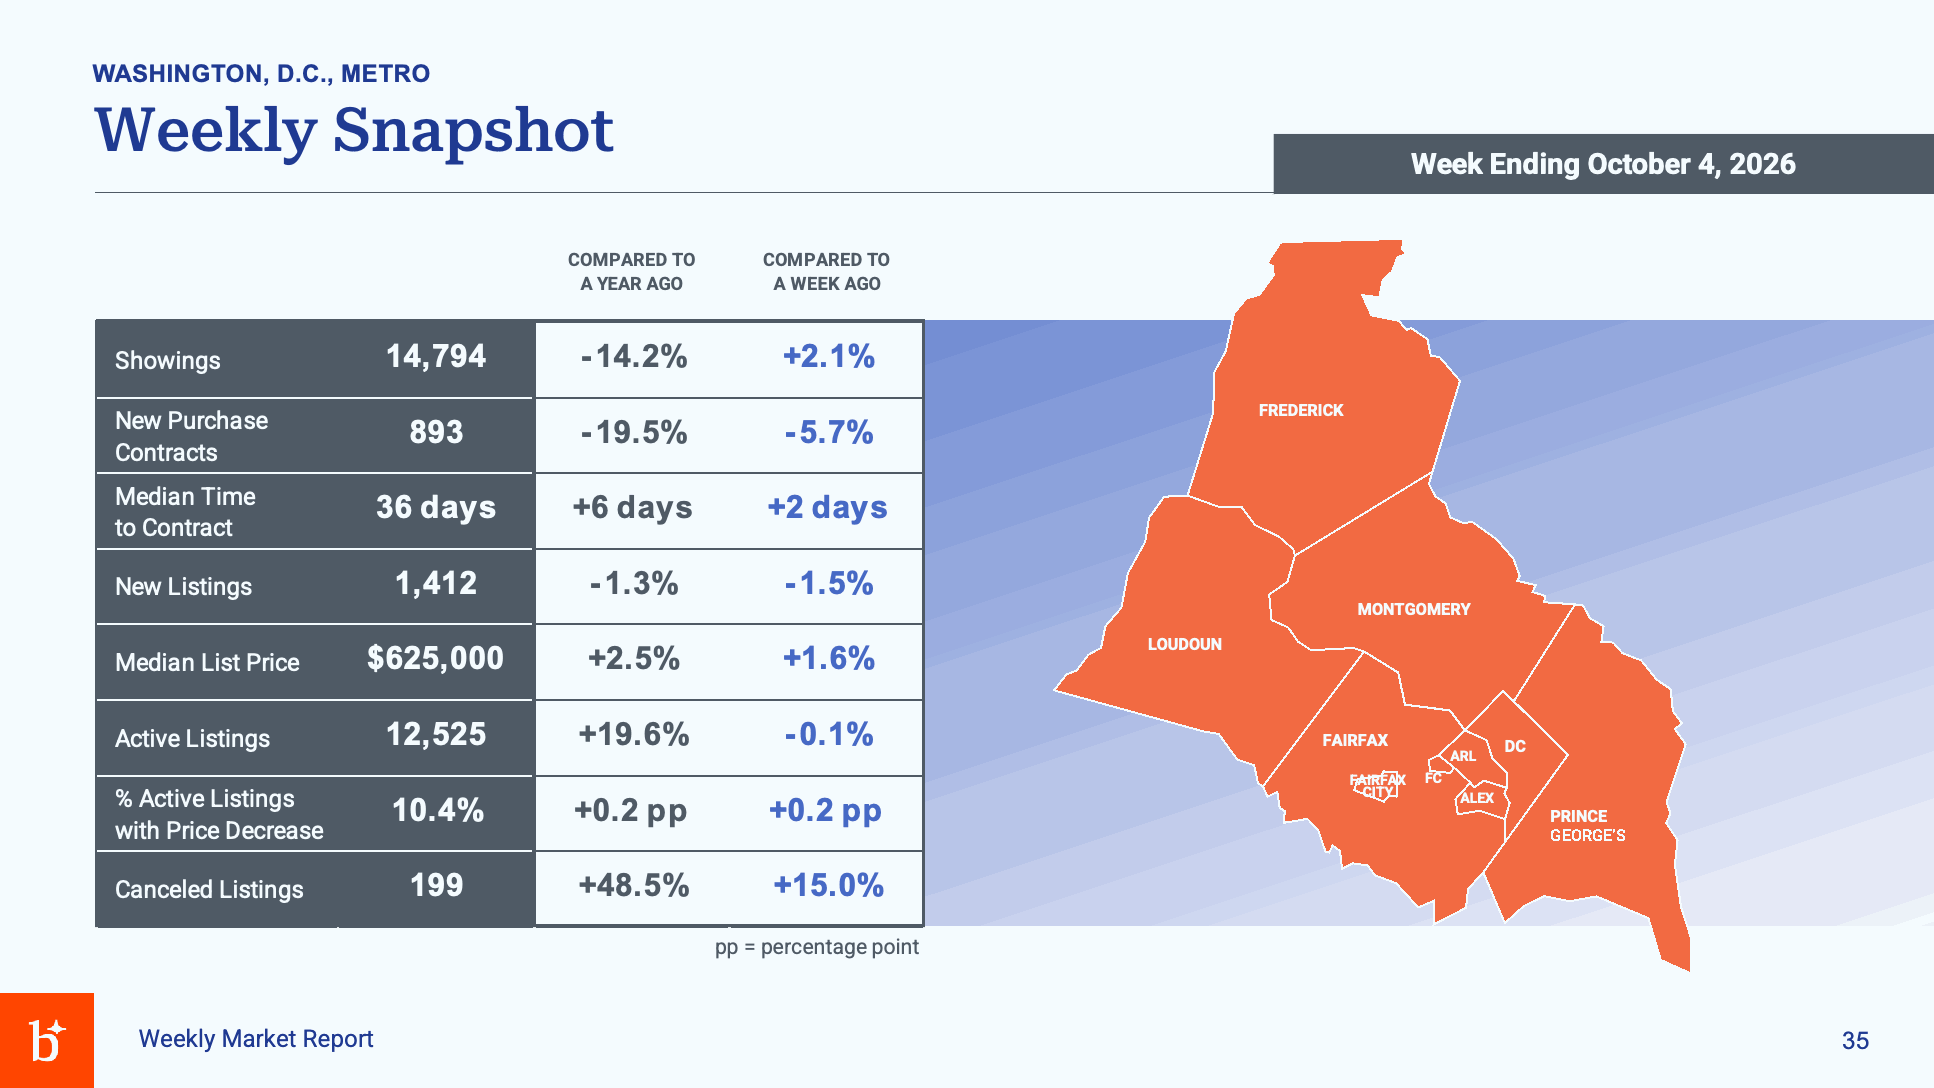
More homes are available across the Washington region, but fewer buyers are signing contracts. Bright MLS's latest weekly report shows a slowdown with sharply different conditions in the District and its suburbs.
By Chris Colgan | October 6, 2026
Washington-area home buyers entered October with more properties to choose from and less competition for signed deals than a year earlier. Sellers, meanwhile, faced a market taking longer to turn listings into contracts.
There were 893 new purchase contracts in the Washington, D.C., metro area during the week ending October 4, down 19.5% from the comparable week in 2025, according to Bright MLS. Active listings totaled 12,525, an increase of 19.6% from a year earlier.
Those two figures point to more room for buyers to compare homes and potentially negotiate. They do not establish that prices are falling across the region, or that every seller needs to accept a discount. The median asking price of homes newly listed that week was $625,000, up 2.5% from a year earlier.
The question for anyone planning a move is how much of that regional shift has reached the particular neighborhood, price range and type of home they are considering.
Featured screenshot: Bright MLS, Weekly Market Report, week ending October 4, 2026, page 35. All report screenshots and market data credited to Bright MLS.
Fewer contracts, longer waits
The slowdown was visible in both annual and weekly comparisons. New purchase contracts fell 5.7% from the previous week. Homes that went under contract took a median of 36 days to do so, six days longer than a year earlier and two days longer than the preceding week.
That 36-day measure describes the homes that secured contracts during the reporting week. It is not the average age of every listing still on the market, and it does not measure the time needed to close a sale.
Bright recorded 14,794 showings, down 14.2% from a year earlier, though up 2.1% from the previous week. Its definition includes both confirmed and canceled showings, so the count should not be read as 14,794 completed buyer visits.
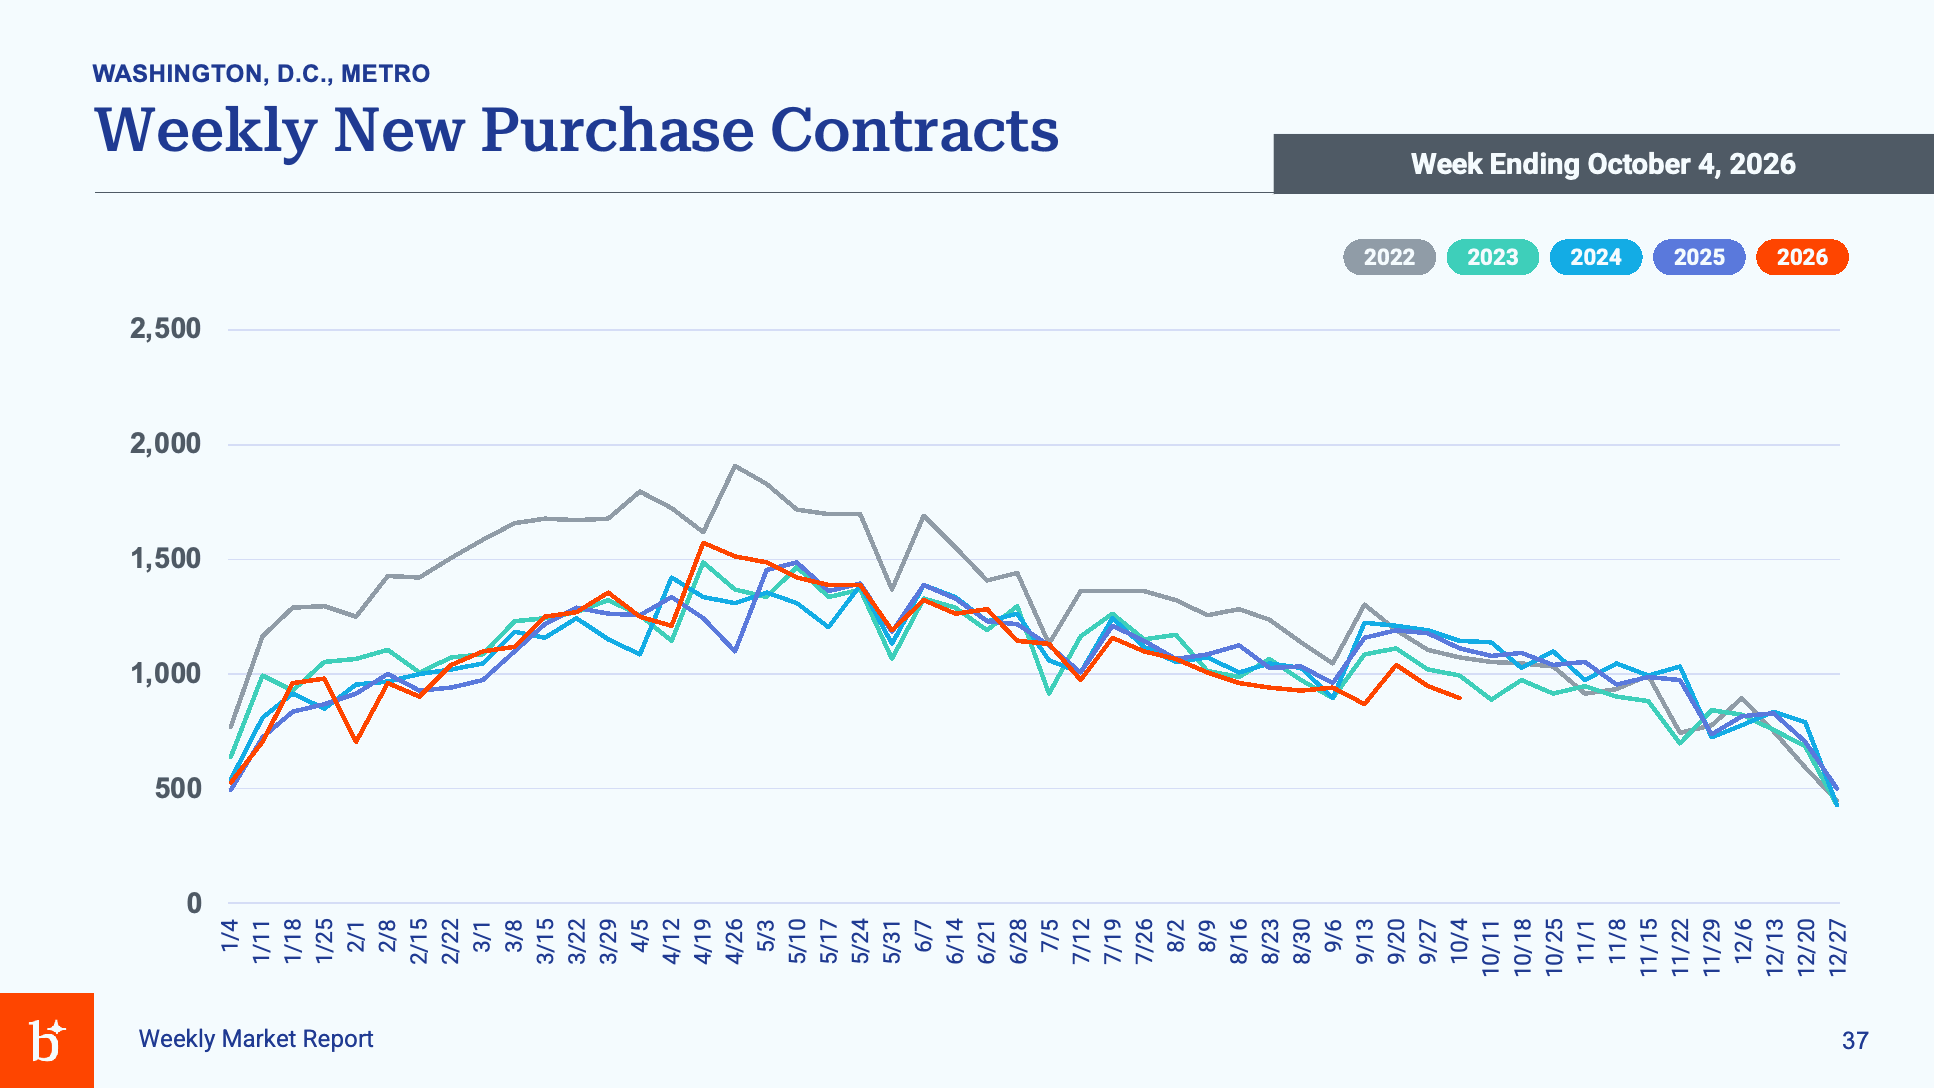
New purchase contracts were down 19.5% year over year. Screenshot: Bright MLS, Weekly Market Report, week ending October 4, 2026, page 37.
In its broader Mid-Atlantic summary, Bright MLS attributes buyer hesitation to high mortgage rates and economic uncertainty. That is the report's regional assessment; the Washington tables do not isolate how much any one factor contributed to the local decline.
More inventory does not mean a flood of new sellers
The increase in available homes came even as the flow of new listings eased. The Washington metro recorded 1,412 new listings, down 1.3% from a year earlier and 1.5% from the previous week. Total active inventory was also down slightly, 0.1%, from the preceding week, despite its large annual increase.
The distinction matters. Active inventory counts the homes available at week's end. New listings count the properties entering the market during the week. A larger inventory can coexist with fewer new listings when homes take longer to find buyers, although this snapshot alone cannot fully explain the inventory change.
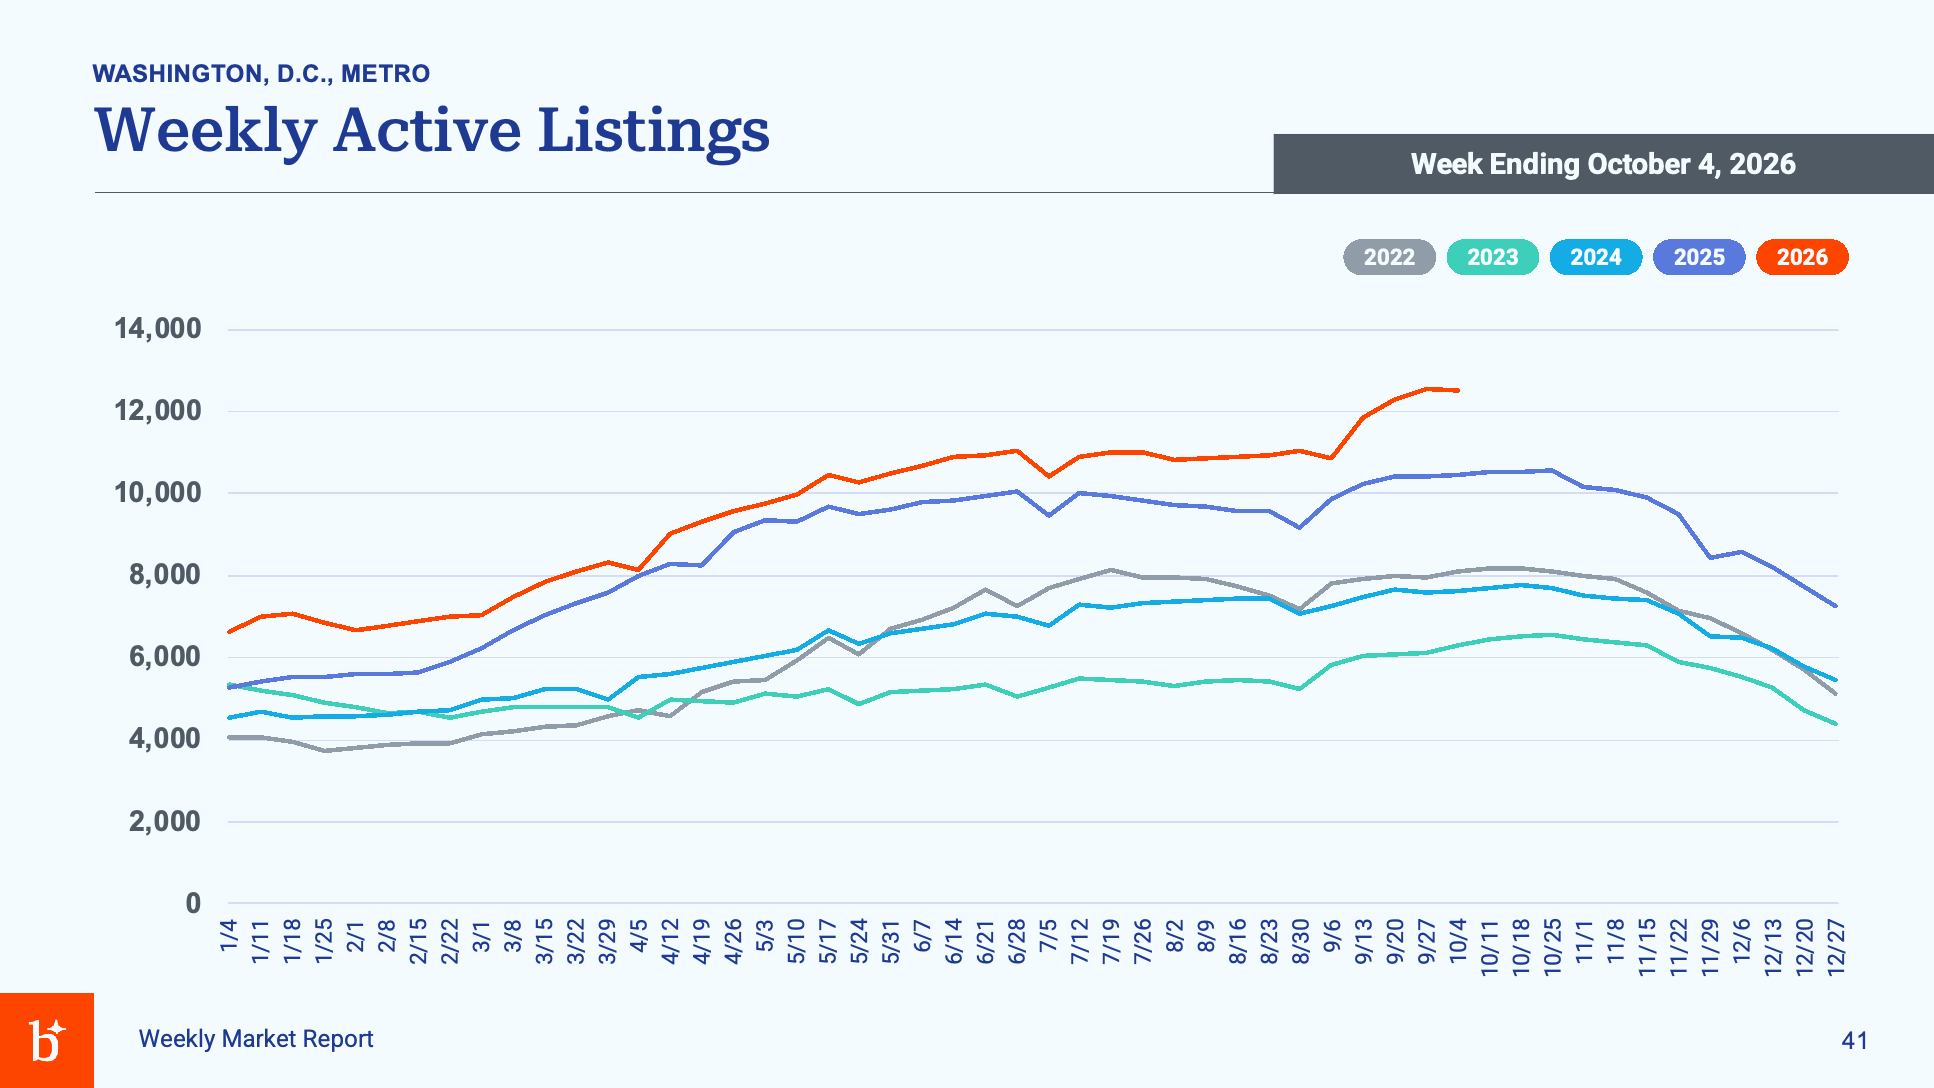
Available inventory remained well above the comparable week in 2025. Screenshot: Bright MLS, Weekly Market Report, week ending October 4, 2026, page 41.
At the same time, 199 listings entered canceled status, up 48.5% from a year earlier and 15% from the previous week. These are canceled listings, not necessarily failed purchase contracts. The figures do not tell us whether those owners will relist, rent out their homes or postpone a move.
The District and the suburbs tell different stories
The region's inventory increase was not evenly distributed. In Washington itself, active listings totaled 2,920, compared with 2,927 in the same week last year. Inventory was essentially flat.
Across the Potomac, Fairfax County had 2,165 active listings, up from 1,589. Loudoun County had 967, up from 712. Those increases were about 36% in each county. Montgomery County's inventory rose from 1,831 to 2,322, about 27%.
| Jurisdiction | Active listings | Same week last year | Annual change |
|---|---|---|---|
| Washington, D.C. | 2,920 | 2,927 | -0.2% |
| Fairfax County | 2,165 | 1,589 | +36.2% |
| Loudoun County | 967 | 712 | +35.8% |
| Arlington County | 558 | 455 | +22.6% |
| Alexandria City | 451 | 343 | +31.5% |
| Montgomery County | 2,322 | 1,831 | +26.8% |
| Prince George's County | 2,224 | 1,823 | +22.0% |
Source: Bright MLS, Weekly Market Report, page 110. Annual changes calculated from the report's counts and rounded to one decimal place. Data cover Bright MLS listings.
Contract activity also varied. Loudoun recorded 77 new contracts, compared with 125 a year earlier. Fairfax County recorded 214, down from 265. Washington recorded 118, down from 135. These are one-week comparisons, not full-month results or forecasts.
Geography requires care, too. Bright's Washington metro grouping includes the District, Frederick, Montgomery and Prince George's counties in Maryland, and Loudoun, Fairfax and Arlington counties plus Alexandria, Fairfax and Falls Church cities in Virginia. The report places Prince William, Stafford and other outer Virginia markets in a separate North Central Virginia grouping. The Washington headline figures should not be applied to those places automatically.
Prince William and Stafford also have more homes available
Outside Bright's Washington metro grouping, Prince William County had 980 active listings, compared with 734 a year earlier, an increase of 33.5%. Stafford had 503, up from 416, or 20.9%. Those annual increases give buyers more listings to consider, though the counts do not show how well that inventory matches a particular budget or commute.
Prince William recorded 92 new purchase contracts, down from 107 a year earlier. Stafford recorded 29, compared with 35. Median time to contract was 31 days in Prince William, versus 27 a year earlier, and 50 days in Stafford, versus 37.
These figures, drawn from Bright's county tables on pages 106, 107 and 110, reinforce the need to look beyond a single Washington headline. A buyer considering Woodbridge and a buyer considering Arlington face different inventory, property choices and contract timelines.
Asking prices leave an important question unanswered
The $625,000 median list price may seem at odds with a slower market. But it measures the midpoint of asking prices among that week's new listings. A different mix of expensive and less expensive properties can change the median even without a comparable change in the value of individual homes.
It is neither a median closed-sale price nor evidence that a particular owner's home gained 2.5% in value.
Meanwhile, 10.4% of listings active at week's end had a price reduction during the week, up 0.2 percentage points from both the year-earlier and previous-week readings. That is a weekly measure, not the share that had ever reduced their asking price.
What buyers and sellers can take from the numbers
For a buyer comparing homes in Fairfax or Loudoun, the larger inventory is a reason to examine alternatives carefully: condition, monthly costs, location and recent comparable sales. It may create opportunities to discuss price or terms, but the report cannot tell a buyer how much a specific seller will concede.
For a seller, the combination of fewer contracts and longer marketing times makes the competing listings especially important. A price based on last year's expectations can be difficult to defend if buyers now have several similar homes to choose from.
In September, I described hearing from buyers who were hesitating over interest rates and from team members whose sellers were struggling with pricing expectations. Those were observations from our conversations, not a statistical survey. This report adds measurable regional context, while underscoring why the next step is a property-specific comparison.
Buyers with a workable budget and flexible timing may find the additional choice useful. Buyers who need a large discount to make a home affordable should not treat these figures as a promise. Sellers can still find buyers, but this week's data give them little reason to assume a quick contract at any asking price.
Questions behind the headlines
Is the Washington housing market crashing?
This weekly report does not establish a crash. It shows fewer new contracts, more active listings than a year ago and a longer median time to contract. It does not provide a closed-sale price trend proving a broad decline in home values.
Are home prices down?
The metro median asking price for new listings was up 2.5% year over year. That does not answer what comparable homes ultimately sold for.
Does the 19.6% inventory increase apply to D.C. itself?
No. It applies to Bright's Washington metro grouping. The District's own active inventory was nearly unchanged from a year earlier.
Does 36 days mean that is how long my home will take to sell?
No. It is the median time to contract for homes entering contracts during that week, not a prediction for a particular listing or a closing timeline.
What should I check before acting?
Compare recent sales and current competition in the same neighborhood and property category, then review price, condition, carrying costs and your moving deadline.
Source and scope: Bright MLS, Weekly Market Report, week ending October 4, 2026, supplied for this article. Washington metro snapshot and charts: pages 35, 37 and 41; local contracts and inventory: pages 106, 107 and 110; definitions: page 113. Broader regional commentary: page 2. Screenshots retain the report's original labels, dates and branding. Analysis by Chris Colgan; data and charts by Bright MLS. More reports: Bright MLS market updates.
Planning a move in Northern Virginia? Compare your buying options with the Chris Colgan Team, or discuss pricing and preparation for your home sale.
Sign up for my Northern Virginia breaking-news newsletter.
Chris Colgan
REALTOR® | Team Leader, Chris Colgan Team
Real Broker, LLC | Powered by PLACE
Call or text: 571-437-7575
Office: 571-621-7660
info@colganteam.com
8427 W Main St, Marshall, VA 20115
ColganTeam.com | ChrisColgan.com

Chris Colgan
Team Leader | Chris Colgan Team | REAL | PLACE
or another way